First Steps
How to start with DockCalc?
You can open an existing calculation or start a new one from scratch.
Starting a new calculation
A new calculation begins with drag and drop of elements from the “repository” (left panel) to the main editor field (middle area):
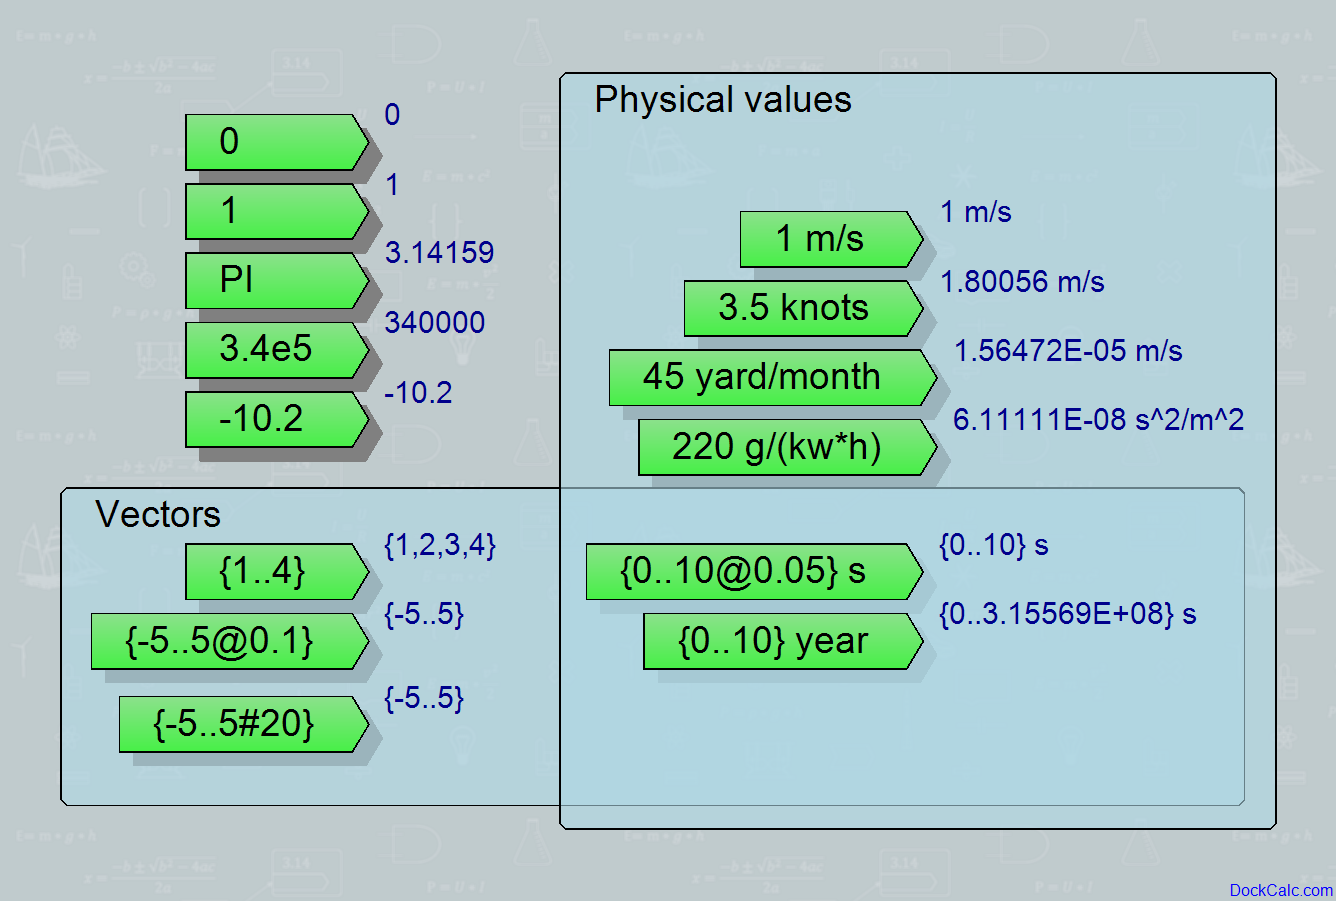
The simplest option is to write a pure number as value like the example below:
- 1
- 2.56
- -42
- 3.56E5 /means 3.56 * 105/
On the other hand, DockCalc is designed to work not just with numbers but with physical values as well.
A physical value consists of a number and a measurement unit like below:
- 1 m or 1m /means 1 meter/
- 4.5 gallon
- -23 inch
- 13.4 kWh/(month*N) /it is an example for some measurement unit put together by multiplying and dividing other well known units/
DockCalc will try its best to understand the meaning of such composed measurement units and in most cases it will succeed
When composing such units, you might need to pay attention not to write something amigous:
km/h and km h is not the same! km h will be understood as km*h (space is handled as multiplication for simplicity).
1 Nm is one Newton*meter but 1 nm is one “nanometer”!
In an advanced case, you might wish to define a vector (maybe really a vector in space having 2 or 3 coordinates) or a longer vector, which is simply a longer list of numbers sharing one common measurement unit
To define a vector, you need to use the { and } brackets:
- {1,2,3,4} /just a list of integer numbers/
- {-2.4,4.56,9.2,-5,5.67} inch / list of different lengths defined in inches/
- {0..100} /which is a list of numbers from 0 to 100/
- {0..10@0.2} /numbers from 0 to 10 in steps of 0.2/
- {0..10#50} /numbers from 0 to 10 in 50 equal steps/
- {-5..5@0.1} knots /speeds from -5 knots to 5 knots in steps of 0.1 knots/
Here you find some examples for values:
Adding a display
Adding a display is possible by drag and drop from the repository or even simpler: pull a connection line (by left mouse dragging) from the right side connection point of a block and release the mouse button over the empty space. A new display will appear and will be connected to the source element to show its output value:

Advanced displays allow to connect or dock any value as display unit candidate. If this display unit is compatible with the value of the display, it will just show a number. If the compatibility is not given, the advanced display will show the missing unit together with the number.
Displaying larger amount of data
Displaying curves
When you are using larger vectors (series of numbers) in your calculation, you might need to display them as a curve.
A Curve can be displayed by the block “Scope”, which needs a horizontal X axis data series and one or more vertical Y data series:
The curve can be zoomed by the mouse wheel. If the mouse cursor is over an x or y axis, only the given axis will be zoomed. Zooming in the scope area will zoom both axis. Resetting the zoom to fit the whole curve can be done with the button on the left side.
Clicking on the unit of the given axis lets you change the measurement unit the values are shown.
Displaying tables
Another way to show larger data sets is the table, which is provided by the “Table” block:
In case of the table you can chose the display unit of each column of data.
Displaying charts
Showing the visual difference in a list of labelled data (like cost components in household or energy consumptions of devices) is possible using the “Chart” block:
Using pictures
To improve your visualization, you can add pictures and connect some key points of them with the relevant calculation units:
Zoom-animation feature
As a Teacher, YouTuber, Presenter you will find the animation feature wery useful. Once you have your visual calculations, you can save different zoom windows by right clicking on the buttons on the right panel. Left mouse click recalls the given zoom window in an animated way. If you have defined your favorite zoom windows, you can start a presentation by pressing F5 or using the top button on the right side. Now you just need the arrow buttons of your keyboard or you can even use a normal presentation pointer device’s up/dn buttons to go back and forth in the list of your zoom windows: